ROC Curves and AUC
The ROC curve and AUC score are fundamental tools for evaluating binary classifiers. They provide a threshold-independent view of model performance.
What is a ROC Curve?
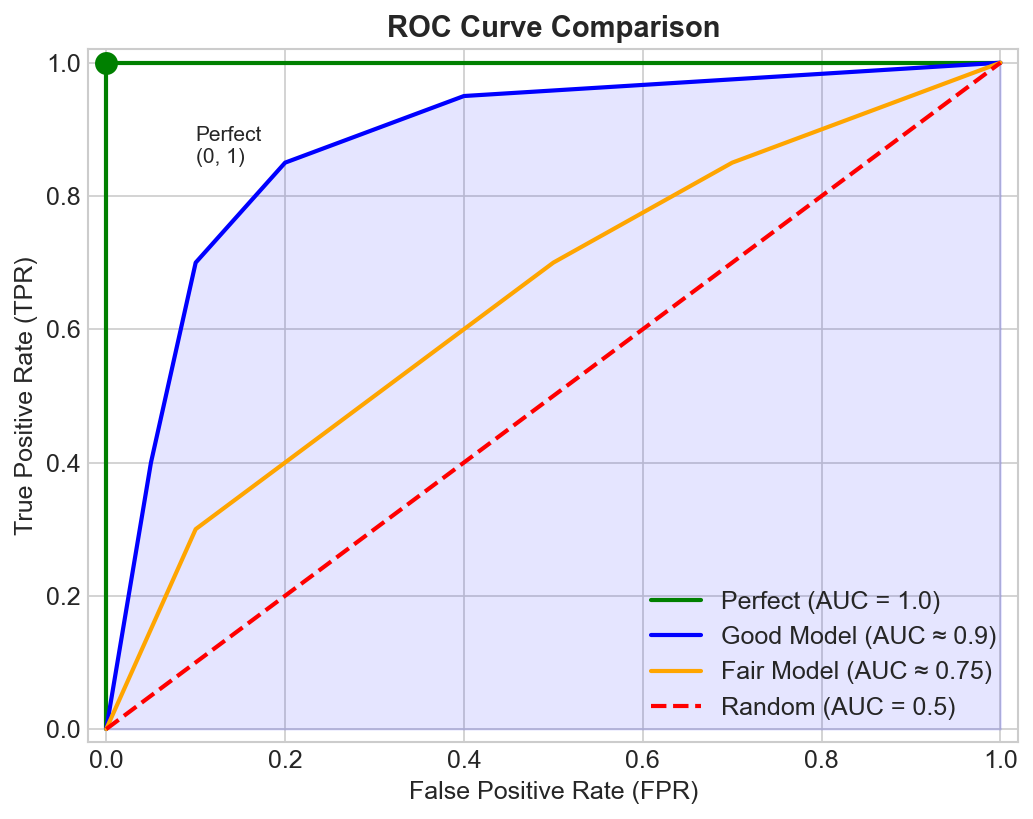
ROC (Receiver Operating Characteristic) plots True Positive Rate (y-axis) vs False Positive Rate (x-axis) at all possible classification thresholds.
The curve starts at (0,0) when threshold is 1.0 (predict nothing positive) and ends at (1,1) when threshold is 0.0 (predict everything positive).
Key Definitions
True Positive Rate (TPR) = Recall = Sensitivity
TPR = TP / (TP + FN)
"Of actual positives, how many did we catch?"
False Positive Rate (FPR) = 1 - Specificity
FPR = FP / (FP + TN)
"Of actual negatives, how many did we incorrectly flag?"
How It Works
- Model outputs probabilities: [0.1, 0.4, 0.6, 0.9, ...]
- For each possible threshold:
- Classify: P(positive) > threshold → positive
- Calculate TPR and FPR
- Plot point on ROC curve
- Connect all points
Interpreting ROC Curves
Key Points on the ROC Space
| Point | Coordinates | Meaning |
|---|---|---|
| Perfect classifier | (0, 1) | TPR=1, FPR=0 - catches all positives, no false alarms |
| All negative | (0, 0) | Predicts everything as negative |
| All positive | (1, 1) | Predicts everything as positive |
| Random classifier | Diagonal line | TPR = FPR at all points |
What Makes a Good Curve?
- Better models: Curve bows toward the upper-left corner (0, 1)
- Worse models: Curve stays close to the diagonal
- Perfect model: Goes from (0,0) straight up to (0,1), then right to (1,1)
AUC (Area Under Curve)
Definition
AUC is the area under the ROC curve, ranging from 0 to 1.
| AUC Value | Meaning |
|---|---|
| 1.0 | Perfect classifier |
| 0.5 | Random classifier (no discrimination) |
| < 0.5 | Worse than random (flip your predictions!) |
Intuitive Interpretation
AUC = P(score(random positive) > score(random negative))
If you pick one positive and one negative example at random, AUC is the probability the model assigns a higher score to the positive.
Quality Guidelines
| AUC | Interpretation |
|---|---|
| 0.9-1.0 | Excellent |
| 0.8-0.9 | Good |
| 0.7-0.8 | Fair |
| 0.6-0.7 | Poor |
| 0.5-0.6 | Fail |
ROC-AUC vs PR-AUC
When to Use ROC-AUC
- Balanced classes
- Care equally about TPR and FPR
- Comparing models across thresholds
When to Use PR-AUC Instead
- Imbalanced data (rare positives)
- Care more about positive class
- False positives are costly relative to true negatives
Why the Difference Matters
With 99% negatives and 1% positives:
If you predict 1% as positive (but all wrong):
- FPR = 0.01 - looks great on ROC!
- Precision = 0 - actually terrible!
ROC-AUC can look good while PR-AUC exposes the problem.
Multi-class ROC
One-vs-Rest (OvR)
Compute ROC for each class vs all others, then average:
AUC_macro = (AUC_class1 + AUC_class2 + ... + AUC_classN) / N
One-vs-One (OvO)
Compute ROC for each pair of classes:
AUC = average of all pairwise AUCs
Computing AUC
In Code
from sklearn.metrics import roc_auc_score, roc_curve
import matplotlib.pyplot as plt

# Calculate AUC score
auc = roc_auc_score(y_true, y_scores)
print(f"AUC: {auc:.3f}")

# Get full curve for plotting
fpr, tpr, thresholds = roc_curve(y_true, y_scores)

# Plot ROC curve
plt.plot(fpr, tpr, label=f'Model (AUC = {auc:.3f})')
plt.plot([0, 1], [0, 1], 'k--', label='Random')
plt.xlabel('False Positive Rate')
plt.ylabel('True Positive Rate')
plt.title('ROC Curve')
plt.legend()
Choosing Operating Points
ROC shows all thresholds, but deployment needs one specific threshold.
Youden's J Statistic
J = TPR - FPR
Optimal threshold = argmax(J)
Maximizes the difference between TPR and FPR.
Cost-based Selection
Cost = C_FP × FPR × N_neg + C_FN × (1-TPR) × N_pos
Choose threshold that minimizes expected cost.
Constraint-based Selection
- "I need at least 95% recall" → find threshold where TPR ≥ 0.95
- "FPR must be below 1%" → find threshold where FPR ≤ 0.01
Common Pitfalls
1. Misleading with Imbalanced Data
AUC can be high even when the model is useless for the minority class. Always check PR-AUC too.
2. Ignoring Calibration
High AUC doesn't mean probabilities are calibrated:
Scores [0.51, 0.52, 0.53] can rank perfectly (high AUC)
but the probabilities are meaningless.
3. Comparing Across Different Datasets
AUC depends on class distribution and inherent difficulty. Only compare on the same test set.
4. Forgetting to Choose a Threshold
AUC is threshold-free for evaluation, but you need a threshold to deploy!
ROC vs Precision-Recall Summary
| Aspect | ROC-AUC | PR-AUC |
|---|---|---|
| Y-axis | TPR (Recall) | Precision |
| X-axis | FPR | Recall |
| Random baseline | 0.5 (diagonal) | Proportion of positives |
| Imbalanced data | Can be misleading | More honest |
| Best for | Balanced datasets | Imbalanced, positive-focused |
Key Takeaways
- ROC plots TPR vs FPR across all thresholds
- AUC summarizes overall discrimination ability (0.5 = random, 1.0 = perfect)
- AUC = probability of ranking a random positive above a random negative
- Use PR-AUC instead for imbalanced data
- AUC is threshold-independent; you still need to choose a threshold for deployment
- Compare models on the same evaluation protocol and dataset