Precision and Recall
Precision and recall are fundamental metrics for classification tasks. They capture different aspects of model performance and understanding their tradeoff is essential for building effective ML systems.
The Basics
For binary classification:
                    Predicted
                  Pos    Neg
Actual  Pos       TP     FN
        Neg       FP     TN
- TP (True Positive): Correctly predicted positive
- FP (False Positive): Incorrectly predicted positive (Type I error)
- FN (False Negative): Incorrectly predicted negative (Type II error)
- TN (True Negative): Correctly predicted negative
Precision
Precision = TP / (TP + FP)
"Of all items I predicted positive, how many were actually positive?"
Also called: Positive Predictive Value (PPV)
Recall
Recall = TP / (TP + FN)
"Of all actual positives, how many did I find?"
Also called: Sensitivity, True Positive Rate (TPR)
Intuitive Examples
Spam Filter
- High precision: Very few legitimate emails marked as spam
- High recall: Very few spam emails reach inbox
Medical Diagnosis
- High precision: When we say "disease", we're usually right
- High recall: We catch most cases of the disease
Search Engine
- High precision: Top results are relevant
- High recall: All relevant pages are found
The Tradeoff
Precision and recall are often at odds:
Threshold ↓ (more positive predictions)
  → More TP (good for recall)
  → More FP (bad for precision)
  → Recall ↑, Precision ↓

Threshold ↑ (fewer positive predictions)
  → Fewer FP (good for precision)
  → Fewer TP (bad for recall)
  → Precision ↑, Recall ↓
When to Prioritize What
Prioritize Precision When:
- False positives are costly
- Users will lose trust with wrong predictions
- Acting on prediction has high cost
Examples:
- Spam filter (don't lose important emails)
- Content moderation (don't wrongly ban users)
- Autonomous vehicles (don't brake unnecessarily)
Prioritize Recall When:
- False negatives are costly
- Missing a positive is dangerous
- Better to over-detect than under-detect
Examples:
- Disease screening (don't miss cancer)
- Fraud detection (don't miss fraud)
- Safety systems (don't miss hazards)
F1 Score
Harmonic mean of precision and recall:
F1 = 2 × (Precision × Recall) / (Precision + Recall)
Properties:
- Ranges from 0 to 1
- Only high when BOTH precision and recall are high
- Harmonic mean penalizes extreme values
Example:
- P=0.9, R=0.1 → F1=0.18 (low!)
- P=0.6, R=0.6 → F1=0.60 (balanced)
F-beta Score
Weighted version when you care more about one:
Fβ = (1 + β²) × (P × R) / (β²P + R)
- β < 1: Precision-focused (F0.5)
- β = 1: Balanced (F1)
- β > 1: Recall-focused (F2)
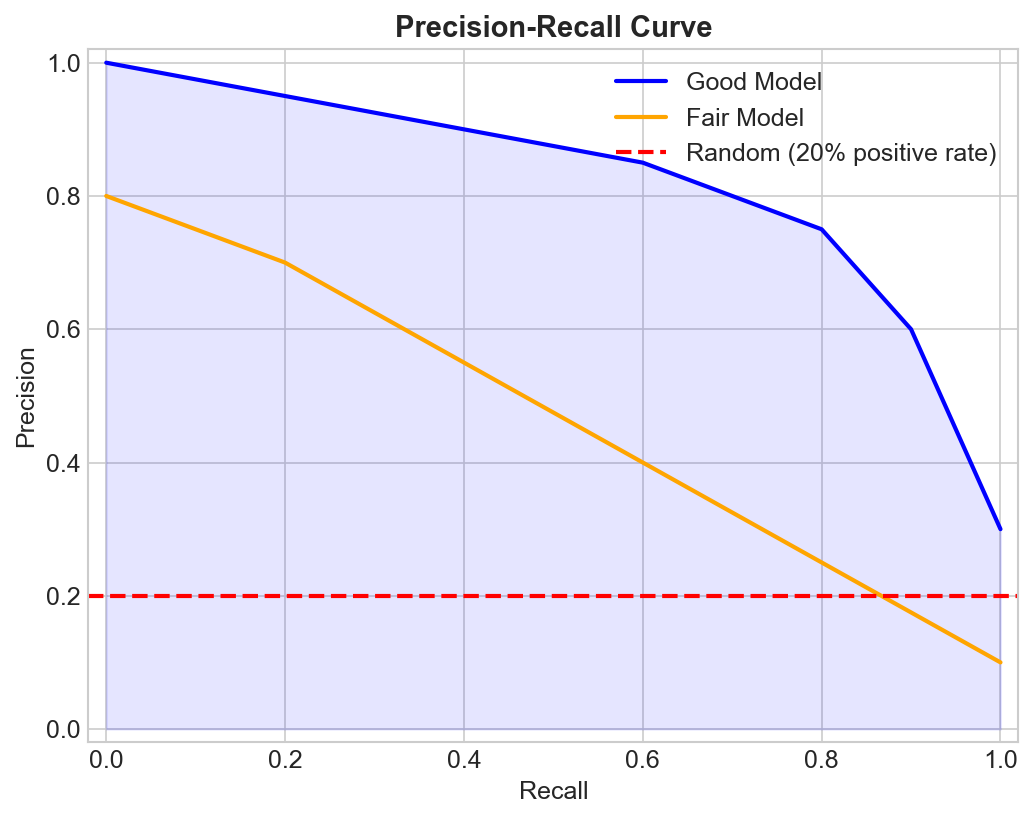
Precision-Recall Curve
Plot precision vs recall at different thresholds:
Precision
    1 |\
      | \
      |  \___
      |      \____
    0 |____________
      0           1
            Recall
Good model: Curve stays high (upper right) Random: Horizontal line at positive rate
Average Precision (AP)
Area under PR curve. Single number summarizing performance.
Multi-class Extensions
Macro Average
Compute metric for each class, then average:
Macro F1 = (F1_class1 + F1_class2 + ... + F1_classN) / N
Treats all classes equally.
Micro Average
Pool all predictions, compute globally:
Micro Precision = Total TP / (Total TP + Total FP)
Weights by class frequency.
Weighted Average
Weight by class support (number of samples):
Weighted F1 = Σ (support_i × F1_i) / total_support
Common Pitfalls
1. Accuracy Isn't Enough
99% class 0, 1% class 1
Predict everything as class 0 → 99% accuracy!
But precision and recall for class 1 = 0
2. Ignoring Class Imbalance
With imbalanced data:
- High precision may be easy (few positives predicted)
- High recall may be meaningful (found rare positives)
3. Threshold Dependence
Precision and recall depend on classification threshold. Always consider at which threshold!
4. Not Matching Business Needs
F1 assumes equal importance. Real costs often differ.
Practical Guidelines
Choosing Metrics
| Scenario | Metric |
|---|---|
| Balanced classes | Accuracy, F1 |
| Imbalanced classes | F1, PR-AUC |
| FP costly | Precision |
| FN costly | Recall |
| Need single number | F1 or F-beta |
| Comparing models | PR-AUC |
Setting Thresholds
- Plot PR curve
- Identify acceptable operating point
- Consider business constraints
- May use cost-sensitive threshold
Key Takeaways
- Precision: correctness of positive predictions
- Recall: coverage of actual positives
- They trade off against each other
- F1 balances both, F-beta weights them
- Choose based on cost of FP vs FN
- Use PR curves and AP for full picture